
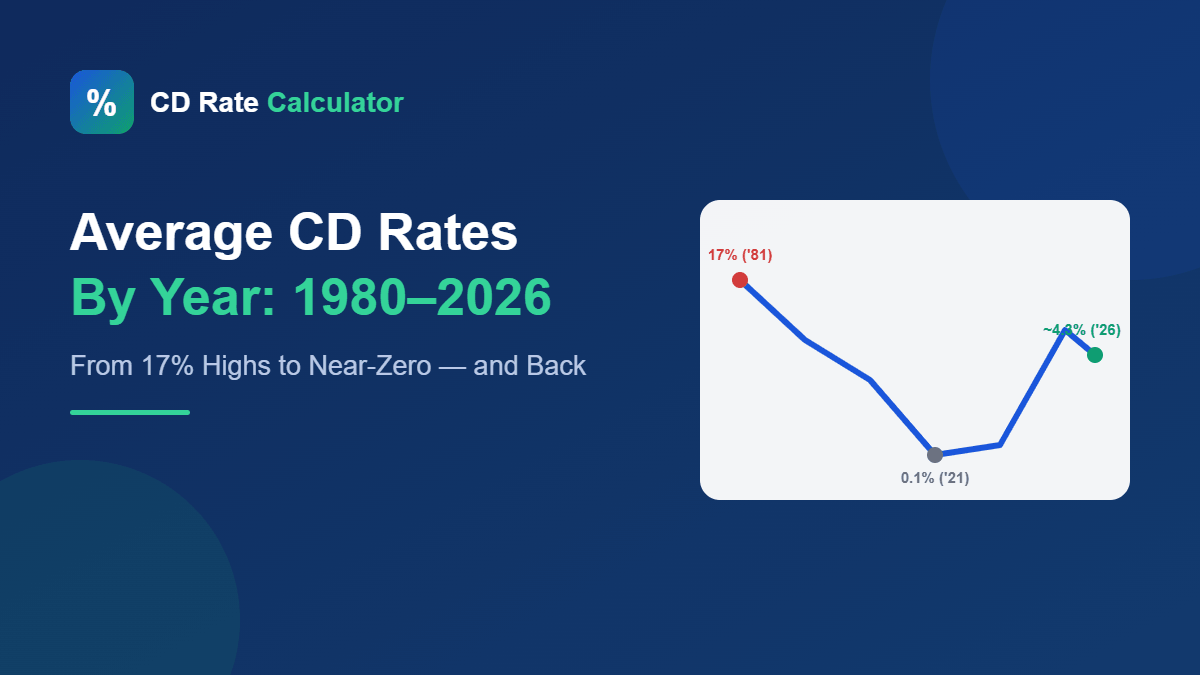
Savers who opened a CD in 1981 locked in rates that sound like typos today — well into the double digits. Their grandchildren, opening CDs in 2021, were offered a fraction of one percent. Few financial products show the sweep of economic history as clearly as the humble CD. Here’s how average CD rates have moved across four and a half decades, and what actually drives them.
A note on the numbers: the figures below are approximate historical averages for short-to-mid-term CDs, drawn from Federal Reserve and FDIC historical data. Exact averages vary by term and source — treat these as the shape of the story, not decimal-point precision. Rates are quoted “as of” their era; for today’s math, use our CD rate calculator.
CD Rates by Era: The Big Picture
| Period | Typical Short/Mid-Term CD Rates | What Was Happening |
|---|---|---|
| 1980–1984 | ~9% to 17%+ | Double-digit inflation; Fed rates at historic highs. The all-time peak — around 1981. |
| 1985–1989 | ~6% to 9% | Inflation tamed; rates descending but still generous. |
| 1990–1999 | ~4% to 7% | Long expansion; CDs a mainstream savings staple. |
| 2000–2007 | ~2% to 5% | Dot-com bust cuts, then a mid-decade climb back above 5%. |
| 2008–2015 | ~0.3% to 2% | Financial crisis; Fed near zero for years. CD dark ages begin. |
| 2016–2019 | ~0.5% to 2.5% | Slow Fed hikes; online banks push top rates near 2.5-3%. |
| 2020–2021 | ~0.1% to 0.6% | Pandemic emergency cuts; the all-time floor. |
| 2022–2023 | ~1% to 5%+ | Fastest hiking cycle in decades; 5%+ CDs return for the first time in ~15 years. |
| 2024–2026 | ~3.5% to 4.5% | Gradual easing off the peak; top online rates around 4.3% as of mid-2026. |
The 1980s: The Rates Nobody Will See Again (Probably)
The early-80s peak wasn’t generosity — it was crisis. Inflation ran into double digits, and the Federal Reserve under Paul Volcker pushed its benchmark rate past 19% to kill it. CDs followed. A saver locking a 5-year CD near 15% in 1981 made one of the great safe-money trades in history: inflation collapsed, but their rate didn’t. The lesson still applies at smaller scale — long CDs are most valuable exactly when rates look scary-high.
The Long Slide: 1990s–2007
As inflation stayed controlled, CD rates settled into the 4-7% band for most of the 90s — high enough that CDs anchored many retirements. The 2000s brought the first taste of near-zero policy after the dot-com bust, then a recovery to 5%+ by 2006. Savers of this era learned the rhythm that still holds: CD rates follow the Fed with a short lag, in both directions.
The Dark Ages: 2008–2021
The financial crisis changed everything. With the Fed at zero for the better part of a decade, average CD rates fell below 1% and stayed there — bottoming during the pandemic, when a typical 12-month CD paid a rounding error. An entire cohort of savers concluded CDs were pointless. They weren’t wrong for that decade — which is precisely why so many people were caught off guard by what came next.
The Comeback: 2022 to Today
When inflation returned in 2022, the Fed delivered its fastest hiking cycle since the Volcker era — and CDs woke up. By 2023, 5%+ CDs were common at online banks for the first time since 2007. Since then, rates have eased gradually; as of mid-2026, top nationally available CDs sit around the low-to-mid 4% range, with the best deals concentrated at online banks. Whether that’s “high” depends entirely on your reference decade — it’s triple the 2010s average and a quarter of the 1981 peak.
What Actually Drives CD Rates
- The federal funds rate — the dominant force. CD rates track it with a lag of weeks.
- Inflation expectations — long-term CD rates bake in where banks think rates are heading, which is why 5-year CDs sometimes pay less than 1-year CDs before expected cuts.
- Bank deposit hunger — banks needing deposits pay up; flush banks don’t. This is why shopping around matters more than timing.
The Real Return Story: CD Rates Minus Inflation
The headline rates only tell half the story — what a CD actually earns is the rate minus inflation, the “real return.” Rerun the decades through that lens and the rankings shuffle surprisingly:
- 1980-1981: a 16% CD sounds unbeatable, but inflation ran 10-13% — the real return was a solid but not mythical 3-6%. The savers who truly won were those whose long CDs kept paying double digits after inflation collapsed in 1983-84, when real returns briefly hit historic highs.
- The 1990s: quietly excellent. CDs at 5-6% against ~3% inflation delivered steady 2-3% real returns for an entire decade — arguably the best sustained era ever for CD savers.
- 2010-2021: the honest label is “guaranteed loss.” CDs at 0.5% against ~2% inflation meant your money’s purchasing power shrank every single year, insurance or not.
- 2023-2026: back to positive territory — mid-4% rates against roughly 2-3% inflation gives a real return near 1-2%, respectable by historical standards.
The lesson: never judge a CD rate in isolation. A 5% CD during 8% inflation is a worse deal than a 3% CD during 1% inflation. It’s the gap that pays you.
Three Rate Moments Worth Remembering
August 1981 — the all-time summit. With the Fed’s benchmark above 19%, some banks briefly offered CDs paying more than mortgage rates do in most eras. Savers who dared to lock five years won historically; many didn’t, fearing rates would go even higher. Peaks only look obvious afterward.
December 2008 — the floor drops out. In one year, the Fed went from 4.25% to effectively zero, and CD rates followed within months. Savers holding longer CDs from 2006-2007 kept earning 5%+ for years into the wasteland — the ladder-holders’ finest hour.
2022-2023 — the great comeback. Eleven rate hikes in under two years resurrected the 5% CD after a 15-year absence. The window stayed wide open for barely eighteen months before rates began easing — another reminder that good rates are for taking, not admiring.
How to Use History When Choosing a Term Today
History can’t predict next year’s rates, but it offers three working rules. First, locate today on the map: mid-4% rates in 2026 sit above the 45-year median — by historical standards, this is a decent time to lock, not a desperate one. Second, respect the speed of change: both the 2008 collapse and the 2022 surge repriced the entire market within months. Whatever today’s rate is, it’s temporary. Third, when in doubt, spread out: a CD ladder is essentially a bet on history’s only constant — that rates will keep moving, in directions nobody reliably calls. Compare what today’s rates produce across terms with our CD comparison calculator.
What History Teaches CD Savers
- You can’t time the peak — you can only lock what’s offered. The 1981 and 2023 savers who won big simply took good rates when they appeared.
- When rates look historically good, favor longer terms. Compare your options with the 5-year CD calculator.
- When rates are falling, ladders beat guessing. A CD ladder averages you across the cycle automatically.
- The “average” rate is not your rate. In every era, top online banks paid far above the national average — the spread today is often a full percentage point.
FAQ
What is the highest CD rate in history?
Short-term CD rates peaked around 17-18% in mid-1981 during the inflation fight — the highest sustained levels in modern U.S. history.
What was the lowest?
The 2020-2021 pandemic era, when average short-term CDs paid roughly 0.1-0.2% and even top online rates struggled to reach 1%.
Are today’s CD rates good historically?
Mid-4% territory is well above the 2008-2021 average and roughly in line with the healthy pre-2008 norm — good by recent memory, ordinary by long history. The better question is whether the rate beats inflation, and by how much.
Will CD rates go back to 1980s levels?
Only under 1980s conditions — sustained double-digit inflation. It’s not impossible, but nobody should build a savings plan waiting for it.
What were average CD rates in the 1990s?
Roughly 4-7% for most of the decade, against about 3% inflation — making the 90s one of the best sustained periods for real (inflation-adjusted) CD returns in modern history.
Do CD rates move with mortgage rates?
They rhyme rather than match. Both respond to Federal Reserve policy, but mortgages track long-term bond yields while CDs track short-term rates more closely. In unusual periods — like an inverted yield curve — short-term CDs can pay more than long-term ones, even while mortgage rates stay high.
Whatever this year’s rates are, see exactly what they earn on your deposit — free CD Rate Calculator.